Foundations of Observability
This first section of the course introduces the foundations of observability by starting with the evolution of application architecture.
Monolithic Architecture
In the early days, web applications were typically built using what is known as a monolithic architecture.
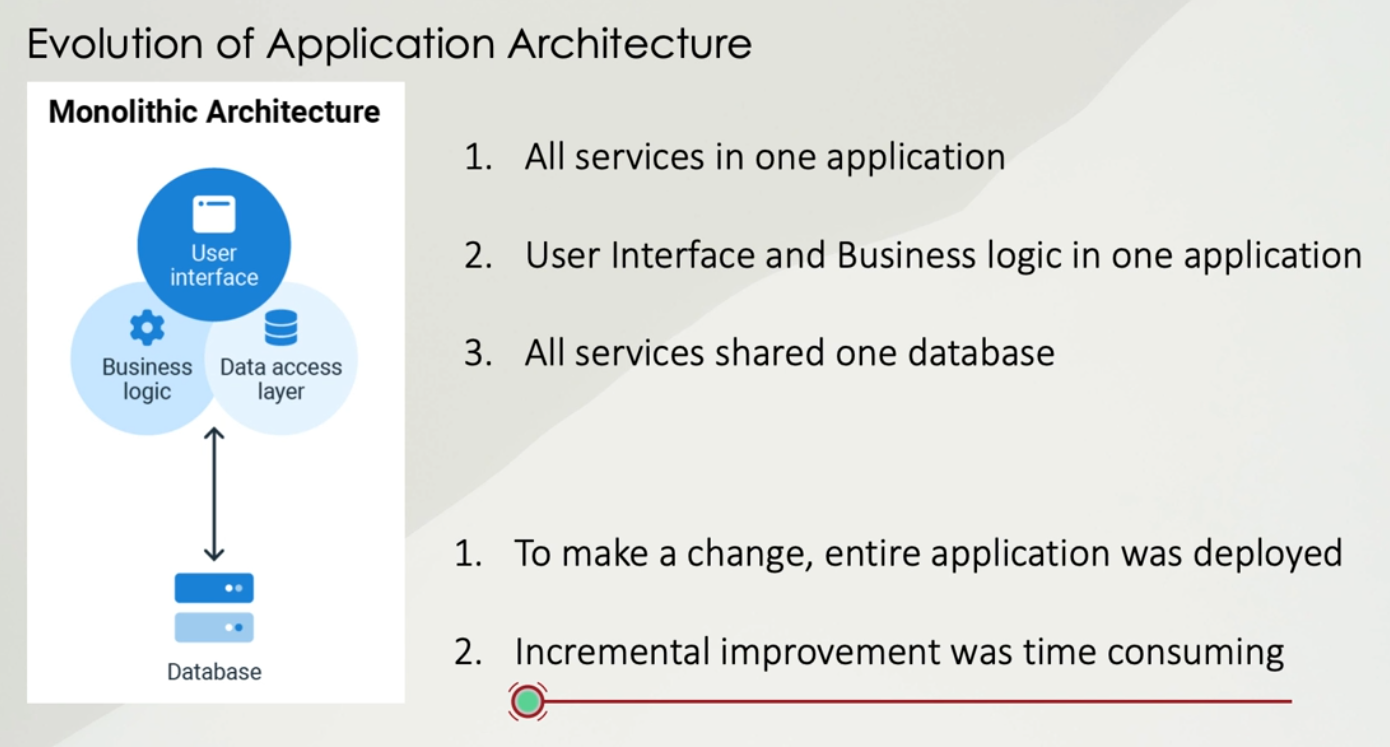
In this model, all the components of an application — for example, payment processing, user registration, and the shopping cart — were combined into one large codebase.
The frontend (such as JavaScript, CSS, HTML) and the backend business logic were all developed together in a single project. Everything ran on a single database.
However, this architecture had its downsides.
If you wanted to make a small change and deploy it to the production environment, you had to deploy the entire application.
This made it difficult and time-consuming to implement frequent or minor improvements.
Teams could only focus on developing one part of the system at a time, and working on multiple features in parallel was challenging.
Microservices Architecture
Over time, the industry moved toward a more flexible approach known as Microservices Architecture.
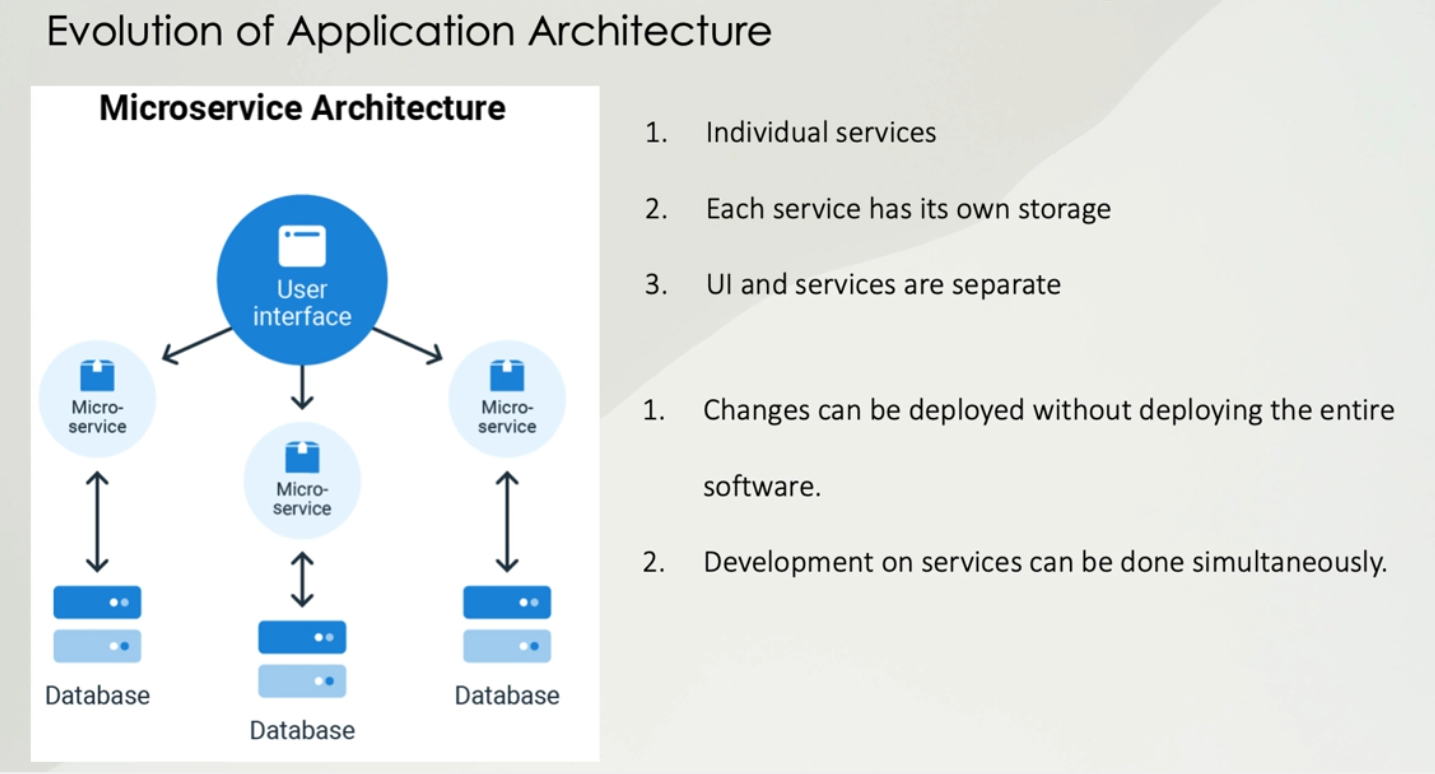
With microservices, the application is broken into small, independent services, and each service has its own separate database or storage.
The user interface is also kept separate from the backend services.
The key advantages of this approach are:
Small updates can be deployed independently, without needing to redeploy the whole system.
Different teams can work on different services at the same time, enabling faster development.
From a DevOps perspective, we can compare:
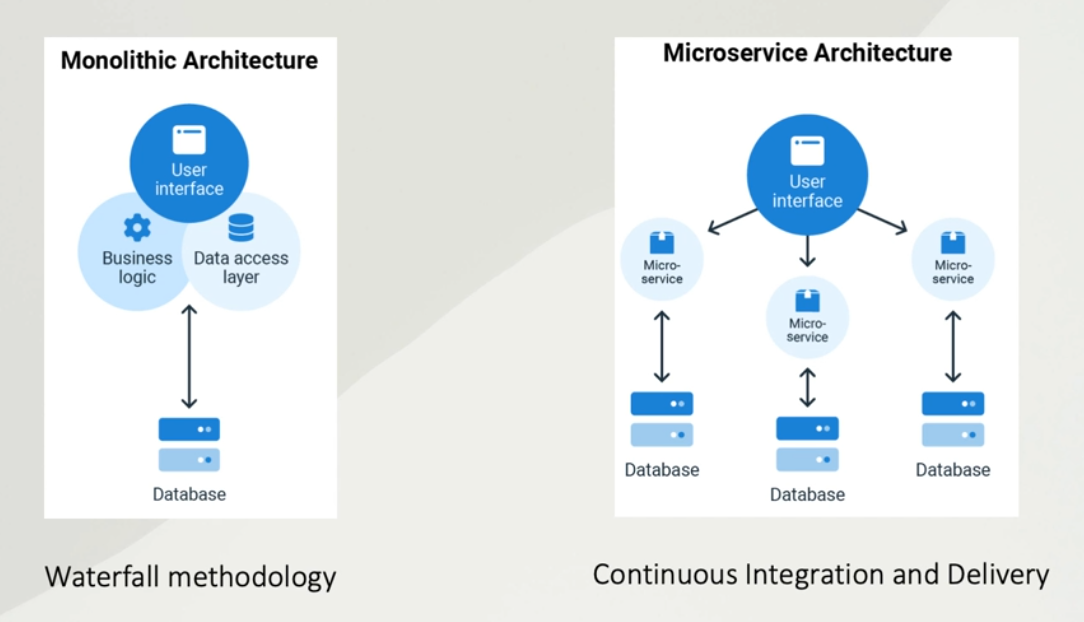
Monolithic architecture to the traditional Waterfall methodology.
Microservices architecture to CI/CD (Continuous Integration and Continuous Delivery).
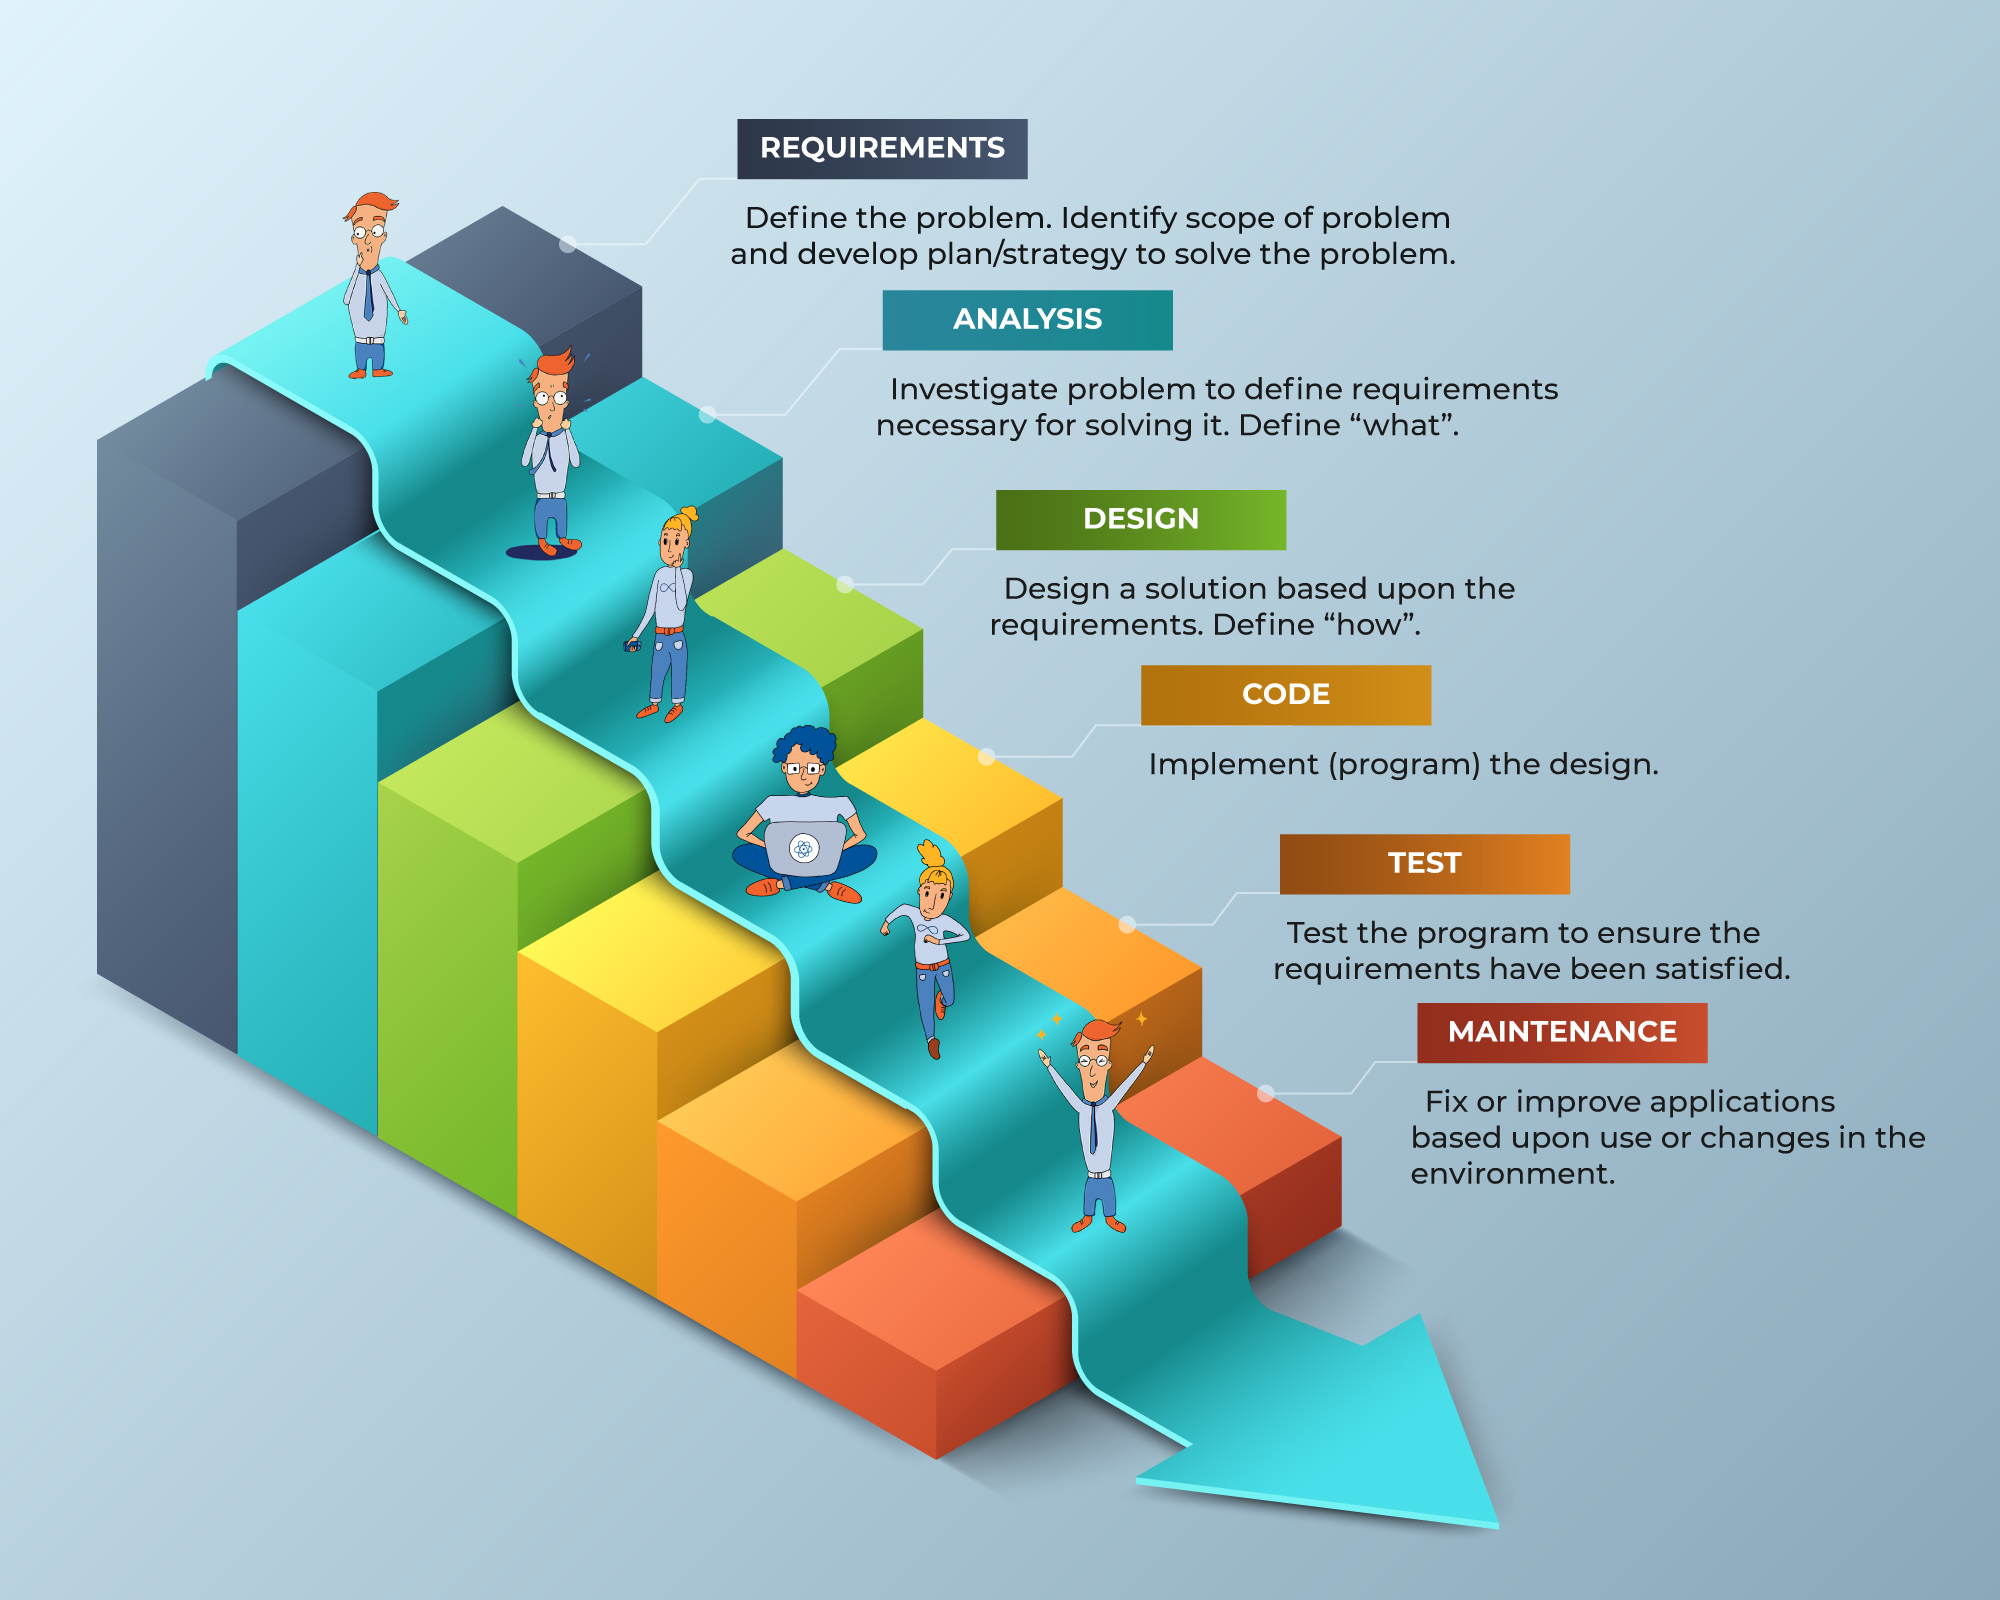
In Waterfall, the software cannot be released until it is fully completed. The process is done step by step: gather requirements → analyze → design → develop → test → deploy.
But in CI/CD, we plan small changes, implement them quickly, build, test, release, deploy — and repeat the cycle frequently.
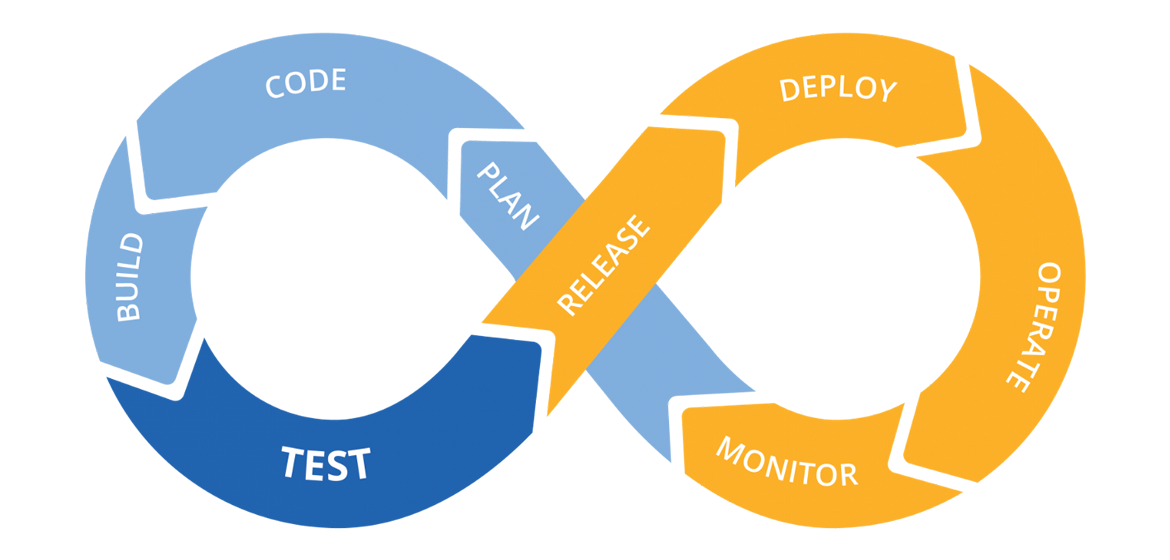

The goal is to keep this cycle short and continuous, rather than waiting to finish an entire system before deployment.
Observability
So, how does all this relate to Observability?
In a microservices environment, you're not managing one large app — you're managing many small services.
This increases the chance that something can go wrong, such as:
A service breaking down.
Communication between services failing (via messages or API calls).
Security threats, since having more services also means a larger attack surface.
Similarly, with CI/CD, you are deploying changes frequently.
Every deployment introduces a risk of failure.
Because of this, it’s essential to have strong observability — meaning the ability to monitor and understand what’s happening in your system in real-time.
Observability helps you catch problems early, understand failures, and ensure the system continues to run smoothly even as changes are made often.
💡 What is Monitoring?
Monitoring is the process of collecting and visualizing data about a system during its runtime — meaning, while it’s actively running.
The goal is to check and track the system’s health, making sure everything works as expected.
Good monitoring helps us answer three important questions:
Is the service running?
Is it working as expected?
Is it performing well?
🚗 A Simple Analogy: The Car Dashboard
Think of a car’s dashboard.
If the engine RPM is above zero, then we know the engine is on → ✅ The service is running.
If the car is moving at 50km/h, then it’s doing what it’s supposed to → ✅ It functions as expected.
But if the engine warning light is on and there are other error indicators, then → ⚠️ It may not be performing well, even though it’s still running and moving.
🌐 Example with a Real Website: "Save the Koala"
Let’s now apply these 3 questions to a real system — the website of the Australian Koala Foundation https://savethekoala.com/ called Save the Koala.
1. Is the service on?
We can check by sending an HTTP GET or HEAD request to the site.
If it responds with a status code 200 OK, it means the site is up and running.
curl -o /dev/null -s -w "%{http_code}\n" https://savethekoala.com/
2. Is the service functioning as expected?
Let's assume the site uses Python on the backend.
This is an internal check that requires access to the server's logs to "monitor and record Python errors."
Error Logging: The Python application on the server should be set up to log errors to a file or a logging service.
Log Monitoring: We use a log management system like Elastic Stack, Splunk, or Datadog to monitor and record Python errors. If the errors stay below a certain threshold (e.g., fewer than 5 errors per minute), we can consider the system to be working properly.
3. Is the service performing well?
This relates to response time.
For example, if an HTTP GET request returns in 20 milliseconds or less, we might say the system is performing well.
curl -o /dev/null -s -w "Total Time: %{time_total}s\n" https://savethekoala.com/
A Simple Python example (monitor.py) - checking if the service is on and how well it is performing.
import requests
import time

def check_website(url):
    try:
        start_time = time.time()
        response = requests.get(url, timeout=5)  # Set a timeout for the request
        end_time = time.time()

        response_time_ms = (end_time - start_time) * 1000

        print(f"Checking URL: {url}")

        # Check if the service is on (Status Code)
        if response.status_code == 200:
            print(f"1. Is the service on? - YES (Status Code: {response.status_code})")
        else:
            print(f"1. Is the service on? - NO (Status Code: {response.status_code})")

        # Check if the service is performing well (Response Time)
        performance_threshold_ms = 20  # Your threshold
        if response_time_ms <= performance_threshold_ms:
            print(f"3. Is the service performing well? - YES (Response Time: {response_time_ms:.2f} ms)")
        else:
            print(f"3. Is the service performing well? - NO (Response Time: {response_time_ms:.2f} ms)")

    except requests.exceptions.RequestException as e:
        print(f"An error occurred: {e}")

if __name__ == "__main__":
    website_url = "https://savethekoala.com/"
    check_website(website_url)
Output:
py monitor.py
Checking URL: https://savethekoala.com/
1. Is the service on? - YES (Status Code: 200)
3. Is the service performing well? - NO (Response Time: 2517.09 ms)
📊 Telemetry Data
The data collected for monitoring is called Telemetry Data.
- It helps identify where a problem is happening or might happen, but it doesn't diagnose the problem.
In microservices-based systems, which consist of many small parts working together, telemetry data can indicate where the problem might be.
📈 Key DevOps Metrics
In DevOps, there are two especially important metrics for monitoring success:
1. Mean Time to Detection (MTTD)
MTTD is the amount of time, on average, between the start of an issue and when teams become aware of it.
2. Mean Time to Resolution (MTTR)
MTTR is the average amount of time between when an issue is detected, and when the systems are fixed and operating normally.
Both MTTD and MTTR are critical indicators of a team's efficiency in handling incidents.
📊 What Metrics Should We Collect for Monitoring?
Now that we understand what monitoring is, the next important question is:
Which metrics should we collect to monitor our system effectively?
Collecting random or irrelevant data won’t help. We need meaningful, structured metrics that reflect the health and performance of each part of our system.
🏗️ Layers of a Microservices-Based Application
A typical microservices-based system can be divided into three main layers:
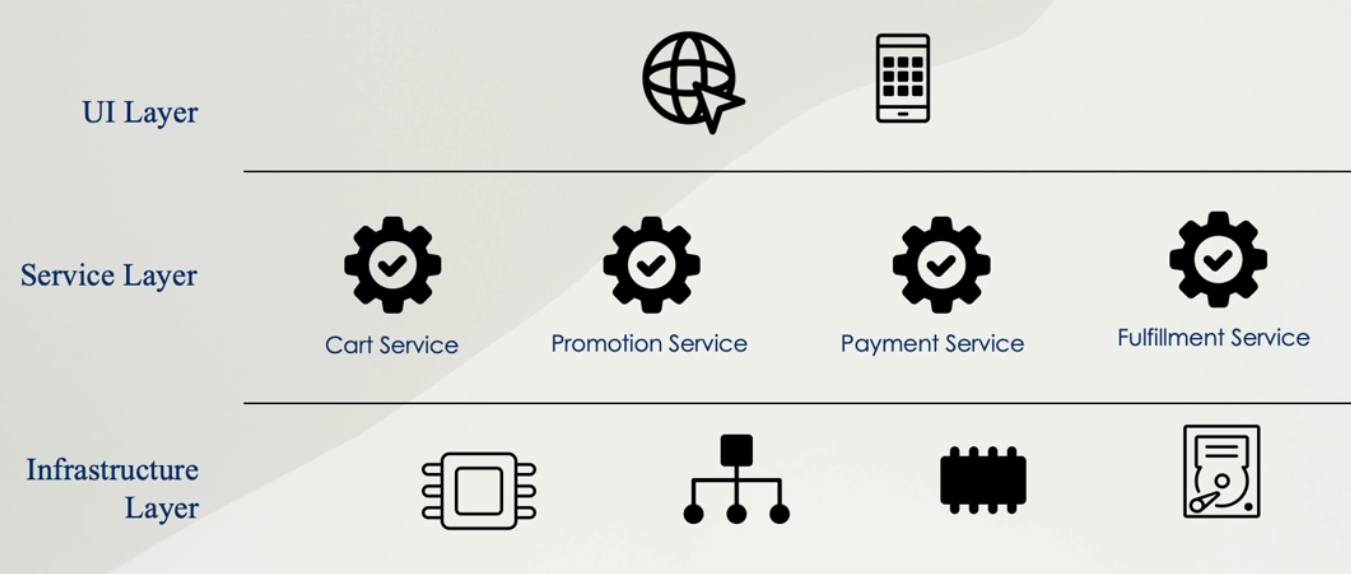
UI Layer – Where users interact via websites or mobile apps.
Service Layer – Where the microservices (like cart service, promotion service, payment service, fulfillment service, etc.) live.
Infrastructure Layer – Which provides the resources (CPU, memory, disk, network) that the services depend on.
🔍 Monitoring Methods by Layer
We use different monitoring frameworks for each layer:
| Method | Covers | Description |
| RED | Service Layer & some UI | Focused on request/response behavior |
| USE | Infrastructure Layer | Focused on resource usage |
| Four Golden Signals | Service & Infra | Google’s recommended core metrics |
| Core Web Vitals | UI Layer | Google’s web performance metrics |
📕 RED Method (Request-driven)
RED stands for:
R – Rate: Number of requests per second (e.g., 2 million req/sec).
E – Errors: Number of failed requests (e.g., HTTP 500s or fatal service errors).
D – Duration: Response time or latency of each request.
🔍 This method is great for measuring how well your services are handling requests.
⚙️ USE Method (Resource-driven)
USE stands for:
U – Utilization: How much of a resource is used (e.g., CPU % or disk %).
S – Saturation: When resources are fully consumed and start queuing (e.g., 100% network usage causes packet delays).
E – Errors: Hardware or system-level errors (e.g., disk write failures).
✅ Ideal values: Low utilization, zero saturation, zero errors.
🛑 Four Golden Signals (by Google)
Google introduced the Four Golden Signals in its Site Reliability Engineering (SRE) Handbook.
If you can only monitor 4 things in a user-facing system, monitor:
Latency – Response time of the system
Traffic – Request volume or throughput
Errors – Failure rate
Saturation – Resource limits being hit
💡 In essence: RED + Saturation = Four Golden Signals.
🌐 Core Web Vitals (UI/Frontend Performance)
Core Web Vitals are performance metrics introduced by Google, specifically for websites, and focus only on the user interface layer.
Largest Contentful Paint (LCP)
- Measures load time perception — how long it takes until the main content is visible to the user.
First Input Delay (FID)
- Measures interactivity — how fast the page reacts when a user tries to interact (like typing into a form).
Cumulative Layout Shift (CLS)
- Measures visual stability — how much the layout shifts unexpectedly during load.
⚠️ These vitals are important for SEO (Search Engine Optimization).
If your Core Web Vitals score is poor, Google may rank your website lower in search results.
🔁 Summary
Each layer of your system requires different kinds of monitoring:
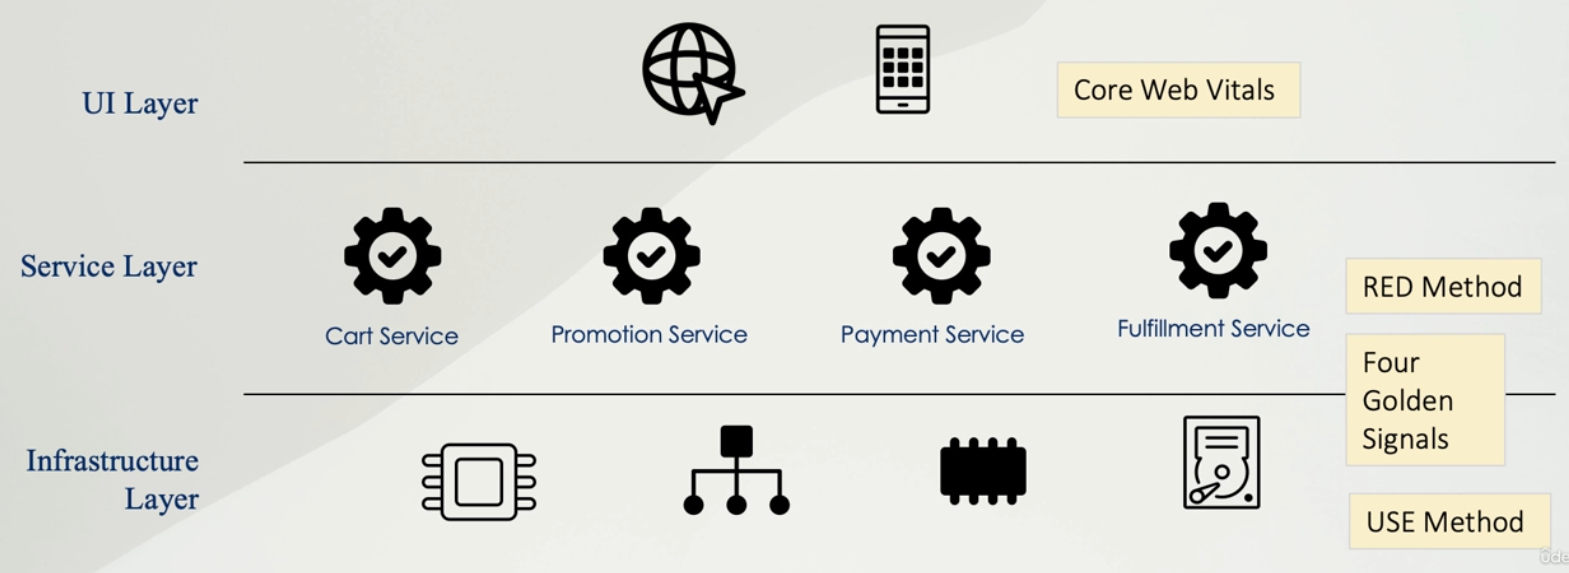
| Layer | Method | What to Track |
| UI | Core Web Vitals | User experience and responsiveness |
| Services | RED / Golden Signals | Requests, errors, latency |
| Infrastructure | USE / Golden Signals | CPU, memory, network usage and limits |
Collecting the right metrics helps you not only monitor but also understand and improve your system's performance and reliability.
🔍 Monitoring vs. Observability
Now that we’ve learned about monitoring, let’s explore a broader and more powerful concept: observability.
✅ Monitoring vs. Observability: Are They Different?
Yes — but not in a conflicting way.
Monitoring is a subset of observability.
Monitoring is necessary, but not enough on its own in modern distributed systems.
🛠️ What’s the Difference?
🔧 Monitoring:
Is predefined — you must know in advance what you want to monitor (e.g., CPU usage, memory, uptime).
Is typically used to detect known issues and verify if the system is working as expected.
Works well in monolithic architectures, where failure points are more predictable.
Answers:
Is the system working?
Where and when did the problem occur?
🌐 Observability:
Helps you discover unknown problems — including those you didn’t anticipate.
Provides a complete view of the system by analyzing multiple types of data (metrics, logs, traces).
Helps in modern, complex systems (like microservices) where components are distributed and interconnected.
Answers:
Why did the issue happen?
What might break next?
🚗 Analogy: The Car Dashboard
Let’s go back to our car dashboard example:
The dashboard lights (e.g., engine light, battery warning) are like monitoring alerts — they show you something is wrong.
But they don’t tell you why it’s happening.
To find the root cause, you take the car to a mechanic.
The mechanic connects a diagnostic device (e.g., via ODB port) to pull detailed data from the car’s systems.
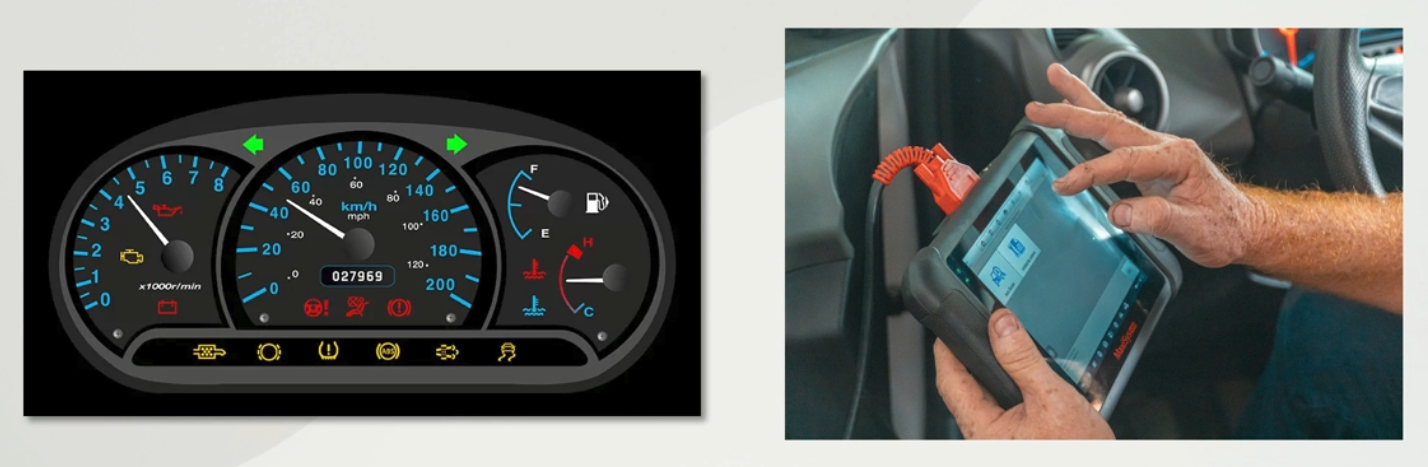
This extra data helps them identify the root cause — just like observability tools do for complex software systems.
📊 Summary Table
| Feature | Monitoring | Observability |
| Purpose | Detect known issues | Discover unknown issues |
| Setup | Predefined metrics | Open-ended data analysis |
| Scope | Narrow (what you chose to monitor) | Broad (system-wide signals) |
| Answers | “Is it working?” / “Where did it break?” | “Why did it break?” / “What could go wrong next?” |
| Best For | Monolithic systems | Microservices / Distributed systems |
| Tool Example | CPU/memory dashboards, alerts | Logs, traces, metrics, unified platforms (e.g., OpenTelemetry, Datadog) |
🔮 The Power of Observability
Observability allows you to:
Understand the “unknown unknowns” — problems you didn’t plan for.
Detect root causes faster — not just symptoms.
Predict and prevent failures — using correlated data across layers.
It’s not just about collecting more data — it’s about collecting the right data and being able to analyze it meaningfully.
📡 What Types of Telemetry Data Are Collected in Observability?
Now that we've covered what observability is, let’s look at the types of telemetry data we collect in an observability platform.
To easily remember these, think of the acronym: MELT:
M = Metrics
E = Events
L = Logs
T = Traces
Each type provides different insights and is valuable for understanding system behavior.
🔔 Events
An event is a specific action that occurred at a particular point in time.
🧃 Example:
Imagine your system is a vending machine.
If a customer buys a bag of chips at 3:20 PM, that’s an event:
The action = purchase
The timestamp = 3:20 PM
📌 Events often flow through event streaming platforms like Apache Kafka, especially in microservices, where services communicate by sending events to each other.
You can also generate custom events within your observability tools — they help confirm that an expected action actually happened.
📈 Metrics
A metric is a numerical, aggregated value that summarizes events over time.
📊 Example (vending machine again):
"100 bags of chips were purchased every minute" — that’s a metric.
It gives you a trend or pattern over time.
Metrics are useful for:
Comparing performance (e.g., “This week vs. last week”)
Identifying performance drops (e.g., sales fell from 200 to 100 per minute)
Metrics help you quantify your system's health and behavior.
📄 Logs
A log is a detailed record of an event — with context.
📋 Example:
Instead of just saying a chip was purchased, a log might say:
“At 3:20 PM, a $2 bag of chips was purchased using Mastercard from vending machine ID: X, located in Sydney.”
🛠 Logs are valuable because they include:
What happened
Where it happened
How it happened
With what data
Logs are often used during troubleshooting or when a more detailed view of the system's behavior is needed.
🔍 Traces
A trace follows a request’s full journey through multiple services in a microservices-based system.
🔄 Example:
If a customer buys chips with a credit card:
Vending machine collects card info
Sends info to the bank
Bank contacts Mastercard
Mastercard responds to the bank
Bank responds to the vending machine
Chips are dispensed
This entire flow is a trace.
📌 If something goes wrong (e.g., slow response, timeout), tracing shows exactly where the failure or delay occurred.
Traces help:
Diagnose latency issues
Visualize service-to-service communication
Identify bottlenecks or fail points
🧠 Summary: MELT
| Type | Purpose | Example |
| Metric | Aggregated performance data over time | “100 purchases per minute” |
| Event | A single, timestamped action | “One bag of chips purchased at 3:20 PM” |
| Log | Detailed record of an event | “Bag of chips ($2), paid with Mastercard, from machine X” |
| Trace | Request path across services | Flow from vending machine → bank → Mastercard → back |
Using MELT data together gives you a complete, observable view of your system — from high-level trends down to specific technical errors and root causes.